
HP Intelligent Management Center v5.2 Application Performance Manager Administrator Guide

176
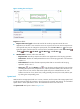
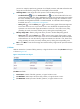
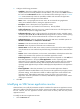
Figure 125 File System Usage Ratio area layout
File System Usage Ratio area fields:
File System Usage Ratio horizontal bar chart—Shows the space usage ratio of each mount point in
the last APM polling period. Hover the cursor over a spot in a bar to view the space usage ratio of
the specified mount point.
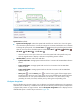
File System—Mount point of the file system in the Linux directory structure.
Usage Ratio—Space usage ratio of the file system.
Set Threshold icon —Click the Set Threshold icon to set alarm thresholds for the Linux file
system usage ratio. The data is highlighted in orange when the file system usage ratio reaches
the level-1 threshold, and is highlighted in red when the file system usage ratio reaches the
level-2 threshold. You can either use the global thresholds or custom thresholds. For information
about setting thresholds, see see "5 Configuration management."
History icon —Click the History icon to view the history graph of the file system usage
ratio trend. Hover the cursor over a spot on the curve to view the data at the specific time point.
Authorized users can view file usage ratio statistics over the last 1 hour, last 6 hours, today,
yesterday, this week, this month, and this year by clicking the corresponding icons.
In Use—Used space of the file system.
Free Space—Free space of the file system.
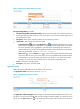
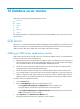
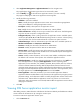
Application Traffic
APM collects Linux traffic based on the IP address of the Linux host.
The Application Traffic area layout is shown in Figure 40.
Figure 126 Application Traffic area layout
The Application Traffic trend graph shows changes of inbound and outbound traffic over the last 1 hour.
The green curve shows the inbound traffic and the orange the outbound traffic. To change the report
period, click the Last 1 Hour icon on the upper right of the graph, and then select an icon from the