
HP Intelligent Management Center v5.2 Application Performance Manager Administrator Guide

185
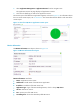
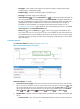
Availability time statistics of a new application monitor are collected since the application monitor was
added. An availability time field does not appear when its value is 0.
Memory Usage
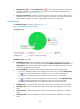
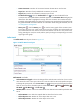
The Memory Usage area layout is shown in Figure 134.
Figure 134 Memory Usage area layout
Memory Usage area fields:
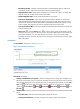
Memory usage trend graph—Shows the memory usage trend of the SQL Server over the last 1 hour
in a line chart. Hover the cursor over a spot on the curve to view the memory usage of the SQL
Server at the specific time point. To change the report period, click the Last 1 Hour icon on the
upper right of the graph, and then select an icon from the list. Available options include Last 6
Hours , Today , Yesterday , This Week , This Month , and This Year .
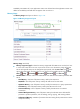
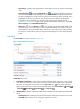
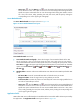
Attribute/Value—Monitor index name and data that was obtained when APM last polled the SQL
Server.
Total Memory—Total size of dynamic memory used by the SQL Server.
SQL Buffer—Size of dynamic memory used by the SQL Server for SQL cache.
Optimizer Memory—Size of dynamic memory used by the SQL Server to query optimization.
Lock Memory—Size of dynamic memory used by the SQL Server for locks.
Connection Memory—Size of dynamic memory used by the SQL Server to maintain
connections.
Granted Workspace Memory—Size of dynamic memory that the SQL Server allocated for
processes to perform operations, such as hashing, sorting, copying, and creating indexes.
Undetermined Memory—Number of processes that were waiting for the permissions to use the
workspace memory.