
HP Intelligent Management Center v5.2 Application Performance Manager Administrator Guide

192
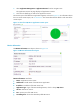
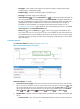
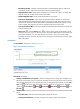
History icon —Click the History icon to view the average latch waiting time trend of SQL
Server. Hover the cursor over a spot on the curve to view the average latch waiting time at the
specific time point. Authorized users can view the average latch waiting time statistics over the
last 1 hour, last 6 hours, today, yesterday, this week, this month, and this year by clicking the
corresponding icons on the upper right of the graph.
Access Method Details
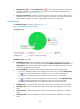
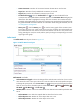
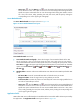
The Access Method Details area layout is shown in Figure 141.
Figure 141 Access Method Details area layout
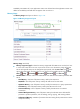
Access Method Details area fields:
Access Method Details trend graph—Shows the changes of access method details of the SQL
Server over the last 1 hour in a line chart. Hover the cursor over a spot on the curve to view the
access method details of SQL Server at the specific time point. To change the report period, click the
Last 1 Hour icon on the upper right of the graph, and then select an icon from the list. Available
options include Last 6 Hours , Today , Yesterday , This Week , This Month , and
This Year .
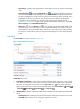
Attribute/Value—Monitor index name and data that was obtained when APM last polled the SQL
Server.
Full Scans/Min—Times of unrestricted base-table or full-index scans per minute.
Range Scans/Min—Times of range scans by using indexes per minute.
Probe Scans/Min—Number of probe scans to directly find at most one single qualified row in
an index or base table per second.
History icon —Click the History icon to view the changes of the access method details of
SQL Server. Hover the cursor over a spot on the curve to view the access method details at the
specific time point. Authorized users can view access method details over the last 1 hour, last 6
hours, today, yesterday, this week, this month, and this year by clicking the corresponding icons
on the upper right of the graph.
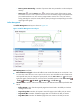
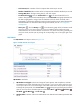
Application Traffic
APM collects SQL Server traffic based on the IP address of the host and the traffic collection port used by
the application. The Application Traffic area layout is shown in Figure 40.