
HP Intelligent Management Center v5.2 Application Performance Manager Administrator Guide

193
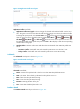
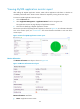
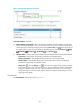
Figure 142 Application Traffic area layout
Application Traffic area fields:
Application Traffic trend graph—Shows changes of inbound and outbound traffic over the last 1
hour. The green curve shows the inbound traffic and the orange curve shows the outbound traffic.
To change the report period, click the Last 1 Hour icon on the upper right of the graph, and then
select an icon from the list. Available options include Last 6 Hours , Today , Yesterday ,
This Week , This Month , and This Year . Hover the cursor over a spot on the curve to view
the application traffic at the specific time point. Click Rx or Tx to display or hide the corresponding
monitor index in the graph.
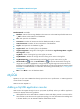
Attribute/Value—Monitor index name and data that was obtained when APM last polled SQL
Server.
Last Hour's Traffic—Total traffic sent and received by SQL Server over the last 1 hour.
Today's Traffic—Total traffic sent and received by SQL Server since 00:00 today.
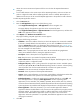
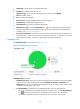
Job Details
The Job Details area layout is shown in Figure 143.
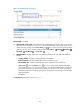
Figure 143 Job Details area layout
Job Details area fields:
Name—Name of the job that had or had not run when APM last polled SQL Server.
State—Job status. The en dash (-) indicates that the job has never run.
Date—Date when the job started running.
Time—Time when the job started running.
Duration—Running duration of the job.
Tries—Times that scheduled jobs tried to run.
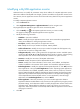
Database Details
The Database Details area layout is shown in Figure 144.