
HP Intelligent Management Center v5.2 Application Performance Manager Administrator Guide

199
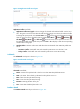
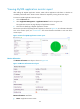
To view the availability of the MySQL application in the last 30 days, click the Monthly History
icon . The monthly availability data is collected in days. To view the time duration
percentages of availability states on a specific day, hover the cursor over that day.
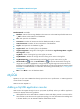
Available Time—Total available time duration of the MySQL application since 00:00 today.
Unavailable Time—Total unavailable time duration of the MySQL application since 00:00 today.
Inaccessible Time—Total inaccessible time duration of the MySQL application since 00:00 today.
Unmanaged Time—Total unmanaged time duration of the MySQL application since 00:00 today.
Availability time statistics of a new application monitor are collected since the application monitor was
added. An availability time field does not appear when its value is 0.
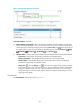
Response Time
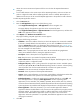
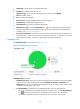
The Response Time area layout is shown in Figure 148.
Figure 148 Response Time area layout
Response Time area fields:
Response Time trend graph—Shows the response time trend of MySQL over the last 1 hour in a line
chart. Hover the cursor over a spot on the curve to view the response time trend of MySQL at the
specific time point. To change the report period, click the Last 1 Hour icon on the upper right of
the graph, and then select an icon from the list. Available options include Last 6 Hours , Today
, Yesterday , This Week , This Month , and This Year .
Attribute/Value—Monitor index name and data.
Response Time—Response time of MySQL when APM last polled MySQL.
Connection Timeout—Time before the connection times out.
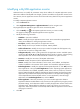
Set Threshold icon —Click the Set Threshold icon to set alarm thresholds for the response
time. The specified alarm thresholds appear on the Response Time trend graph as dotted lines.
The data is highlighted in orange when the response time reaches the level-1 threshold, and is
highlighted in red when the response time reaches the level-2 threshold. Use the global
thresholds or custom thresholds. For information about setting the thresholds, see "5
Configuration management."
History icon —Click the History icon to view the history graph of the response time
trend. Hover the cursor over a spot on the curve to view the response time at the specific time
point. Authorized users can view the response time statistics over the last 1 hour, last 6 hours,