
HP Intelligent Management Center v5.2 Application Performance Manager Administrator Guide

202
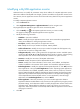
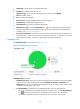
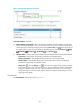
Figure 151 Thread Details area layout
Thread Details area fields:
Thread Details trend graph—Shows the trend of thread details over the last 1 hour in a line chart.
Hover the cursor over a spot on the curve to view the thread details at the specific time point. To
change the report period, click the Last 1 Hour icon on the upper right of the graph, and then
select an icon from the list. Available options include Last 6 Hours , Today , Yesterday ,
This Week , This Month , and This Year .
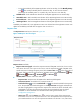
Attribute/Value—Monitor index name and data that was obtained when APM last polled the
MySQL.
Running Threads—Number of running threads in the MySQL.
Buffered Threads—Number of buffered threads in the thread cache.
Thread Buffer Size—Number of threads that can be buffered in the thread cache.
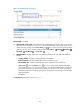
History icon —Click the History icon to view the history graph of the thread details
trend. Hover the cursor over a spot on the curve to view the thread details at the specific time
point. Authorized users can view the thread details over the last 1 hour, last 6 hours, today,
yesterday, this week, this month, and this year by clicking the corresponding icons on the upper
right of the graph.
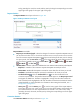
Key Details
The Key Details area layout is shown in Figure 152.