
HP Intelligent Management Center v5.2 Application Performance Manager Administrator Guide

205
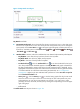
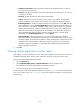
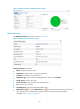
Figure 154 Table Lock Statistic area layout
Table Lock Statistics area fields:
Table Lock Statistics trend graph—Shows the changes of the table lock statistics over the last 1 hour
in a line chart. Hover the cursor over a spot on the curve to view table lock statistics per minute at
the specific time point. To change the report period, click the Last 1 Hour icon on the upper right
of the graph, and then select an icon from the list. Available options include Last 6 Hours , Today
, Yesterday , This Week , This Month , and This Year .
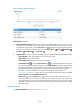
Attribute/Value—Monitor index name and data that was obtained when APM last polled MySQL.
Table Locks Immediately Released/sec—Number of the immediately released table locks per
minute.
Table Locks Wait/sec—Number of the waiting table locks.
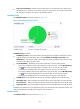
History icon —Click the History icon to view the history graph of the table lock statistics.
Hover the cursor over a spot on the curve to view table lock statistics at the specific time point.
Authorized users can view table lock statistics over the last 1 hour, last 6 hours, today, yesterday,
this week, this month, and this year by clicking the corresponding icons on the upper right of the
graph.
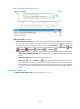
SQL Operation Statistics/min
The SQL Operation Statistics/min area layout is shown in Figure 155.