
HP Intelligent Management Center v5.2 Application Performance Manager Administrator Guide

206
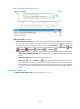
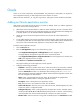
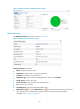
Figure 155 SQL Operation Statistics/min area layout
SQL Operation Statistics/min area fields:
SQL Operation Statistics/min trend graph—Shows the trend of the My SQL executing the Delete,
Insert, Select, and Update statements per minute over the last 1 hour in a line chart. Hover the cursor
over a spot on the curve to view the SQL operation statistics at the specific time point. To change the
report period, click the Last 1 Hour icon on the upper right of the graph, and then select an icon
from the list. Available options include Last 6 Hours , Today , Yesterday , This Week
, This Month , and This Year .
Attribute/Value—Monitor index name and data that was obtained when APM last polled MySQL.
Deletes—Number of Delete statements executed by MySQL per minute.
Adds—Number of Insert statements executed by MySQL per minute
Queries—Number of Select statements executed by MySQL per minute.
Updates—Number of Update statements executed by MySQL per minute.
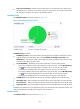
History icon —Click the History icon to view the history graph of SQL operation statistics
trend. Hover the cursor over a spot on the curve to view the SQL operation statistics at the
specific time point. Authorized users can view SQL operation statistics over the last 1 hour, last
6 hours, today, yesterday, this week, this month, and this year by clicking the corresponding
icons on the upper right of the graph.
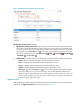
Application Traffic
APM collects MySQL traffic based on the IP address of the host and the traffic collection port used by the
application. The Application Traffic area layout is shown in Figure 156.