
HP Intelligent Management Center v5.2 Application Performance Manager Administrator Guide

213
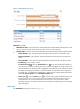
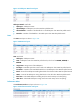
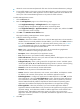
Figure 161 Database Details area layout
Database Details area field:
Creation Time—Time when Oracle installation was completed.
Open Mode—Current open mode for Oracle. Open Modes include READ ONLY and READ WRITE.
Logging Mode—Current logging mode for Oracle. The logging modes include the following types:
ARCHIVELOG—Old log files are automatically copied to a specified path and cannot
overwritten by new log files during the log file switch.
NOARCHIVELOG—Old log files are overwritten by new log files during the log file switch.
Free Memory—Available memory in SGA when APM last polled Oracle.
Size—Size of disk space used by all the datafiles in Oracle when APM last polled Oracle.
Block Size—Default standard block size in Oracle.
Average Execution Times—Average times of executing all the SQL statements in Oracle when APM
last polled Oracle.
Reads—Times of Oracle reading data blocks from the disk when APM last polled Oracle.
Writes—Times of Oracle writing data blocks to the disk when APM last polled Oracle.
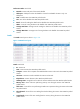
Set Threshold icon —Click the Set Threshold icon to set alarm thresholds for the average
execution times. The data is highlighted in orange when the average execution time reaches the
level-1 threshold, and is highlighted in red when the average execution time reaches the level-2
threshold. Use the global thresholds or custom thresholds. For information about setting the
thresholds, see "5 Configuration management."
History icon —Click the History icon to view the history graph of the database details trend.
Hover the cursor over a spot on the curve to view the database details at the specific time point.
Authorized users can view the database details over the last 1 hour, last 6 hours, today, yesterday,
this week, this month, and this year by clicking the corresponding icons on the upper right of the
graph.
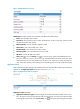
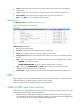
Connection Time
The Connection Time area layout is shown in Figure 162.