
HP Intelligent Management Center v5.2 Application Performance Manager Administrator Guide
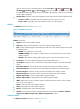

215
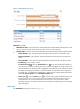
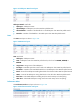
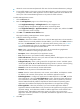
Figure 163 SGA State area layout
SGA State area fields:
SGA State bar chart—Shows the hit ratio of each SGA cache when APM last polled Oracle in a bar
chart. To view the hit ratio of the cache, hover the cursor over the proper bar.
Attribute/Value—Monitor index name and data that was obtained when APM last polled Oracle.
Buffer Hit Ratio—How often the required information has been found in the buffer cache.
Dictionary Hit Ratio—How often the required information has been found in the dictionary
cache.
Library Hit Ratio—How often the required information has been found in the library cache.
Free Memory—Free memory in SGA.
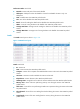
Set Threshold icon —Click the Set Threshold icon to set alarm thresholds for buffer hit
ratio, dictionary hit ratio, and library hit ratio. The data is highlighted in orange when the hit
ratio reaches the level-1 threshold, and is highlighted in red when the hit ratio reaches the level-2
threshold. Use the global thresholds or custom thresholds. For information about setting the
thresholds, see "5 Configuration management." Higher hit ratio indicates better performance.
Select Less than or Equal to in the Threshold Condition field.
History icon —Click the History icon to view the history graph of the SGA state trend.
Hover the cursor over a spot on the curve to view the SGA state at the specific time point.
Authorized users can view the SGA state trend over the last 1 hour, last 6 hours, today,
yesterday, this week, this month, and this year by clicking the corresponding icons on the upper
right of the graph.
SGA Details
This SGA Details area layout is shown in Figure 164.