
HP Intelligent Management Center v5.2 Application Performance Manager Administrator Guide

227
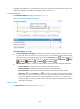
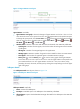
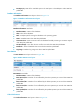
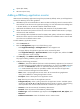
Figure 177 Agent Statistics area layout
Agent Statistics area fields:
Agent Statistics trend graph—Shows the changes of agent statistics over the last 1 hour in a line
chart. Hover the cursor over a spot on the curve to view the agent statistics at the specific time point.
To change the report period, click the Last 1 Hour icon on the upper right of the graph, and then
select an icon from the list. Available options include Last 6 Hours , Today , Yesterday ,
This Week , This Month , and This Year .
Attribute/Value—Monitor index name and data that was obtained when APM last polled DB2.
Active Agents—Number of active agents, which is the number of total agents minus the number
of idle agents.
Idle Agents—Number of unassigned agents to the applications.
Waiting Agents—Maximum number of agents that have waited for tokens since DB2 started.
Total Agents—Total number of registered agents in the DB2 instance manager.
History icon —Click the History icon to view the history graph of the agent statistics
trend. Hover the cursor over a spot on the curve to view the agent statistics at the specific time
point. Authorized users can view agent statistics over the last 1 hour, last 6 hours, today,
yesterday, this week, this month, and this year by clicking the corresponding icons on the upper
right of the graph.
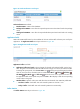
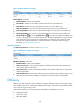
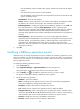
Tablespace Details
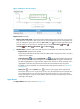
The Tablespace Details area layout is shown in Figure 178.
Figure 178 Tablespace Details area layout
Tablespace Details area fields:
Name—Name of the tablespace.
Free Bytes—Available space in the tablespace when APM last polled DB2.
Allocated Bytes—Space that the database manager allocated for the tablespace when APM last
polled DB2.