
HP Intelligent Management Center v5.2 Application Performance Manager Administrator Guide

18
Type of application (Default)
Host
Speed (bps)
Rx (bps)
Tx (bps)
Traffic (H)
In Traffic (H)
Out Traffic (H)
Traffic (D)
In Traffic (D)
Out Traffic (D)
Availability (Default)
Health status (Default)
Dependency Topology
Management status (Default)
Contact
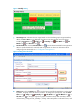
The speed, Rx, Tx, and traffic columns appear only when probes are configured for APM. For
information about configuring probes, see "Probe Configuration."
4. Select the columns you want to display in the application monitor list.
5. Click the Move Up icon or Move Down icon to modify the rank of the columns in the
application monitor list.
6. Click Reset if you want to restore the default columns and rank of the application monitor list.
7. Click OK.
Viewing associated applications
When a Windows application is monitored through WMI, APM automatically detects all unmonitored
applications that are deployed on the Windows application. Operators can view these associated
applications for the Windows application monitor.
To view associates applications:
1. Click the Resource tab.
2. Select Application Manager > Application Monitor from the navigation tree.
The application monitor list page displays all application monitors.
3. Click the Association icon for the Windows application montior for which you want to view
the associated applications.
The Result list page displays all unmonitored applications that are associated with the Windows
application monitor.
Result list contents
Device—IP address of the host on which the monitored Windows application is located.
Device Name—Hostname of the Windows OS.
Application Type—Type of the application that is associated with the monitored Windows
application and not monitored by APM. The application type can be Performance Counter,