
HP Intelligent Management Center v5.2 Application Performance Manager Administrator Guide

255
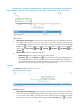
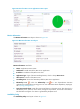
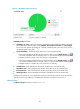
Figure 206 Just In Time (JIT) is the .NET framework compiler which converts the Microsoft Intermediate
Language (MSIL) to native code on an as needed basis. CPU usage is a major indicator of JIT. JIT area layout
JIT area fields:
CPU usage in JIT trend graph—Shows the CPU usage trend of JIT over the selected time period in
a line graph. Hover the cursor over a spot on the curve to view the CPU usage at the specific time
point. By default, the graph shows the last 1 hour data. To change the report period, click the Last
1 Hour icon on the upper right of the graph, and then select an icon from the list. Available
options include Last 6 Hours , Today , Yesterday , This Week , This Month , and
This Year .
Attribute/Value—Monitor index name and data.
CPU Usage in JIT—CPU usage of JIT in the last polling interval.
History icon —Click the History icon to view trend statistics of history CPU usage of JIT in
a line graph. Hover the cursor over a spot on the curve to view the data at the specific time
point. Authorized users can view statistics over the last 1 hour, last 6 hours, today, yesterday, this
week, this month, and this year by clicking the corresponding icons.
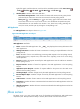
Security
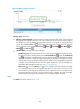
The Security area layout is shown in Figure 207.
Figure 207 Security area layout
Security area fields:
Total runtime check trend graph—Shows changes of the total number of runtime checks performed
by the .NET server over the selected time period in a line graph. Hover the cursor over a spot on the
curve to view the total number of runtime checks at the specific time point. By default, the graph
shows the last 1 hour data. To change the report period, click the Last 1 Hour icon on the upper