
HP Intelligent Management Center v5.2 Application Performance Manager Administrator Guide

272
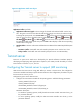
Availability time statistics of a new application monitor are collected since 00:00 on the day when the
application monitor was added. An availability time field does not appear if its value is 0.
Performance
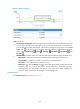
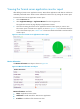
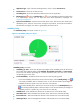
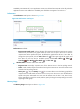
The Performance area layout is shown in Figure 220.
Figure 220 Performance area layout
Performance area fields:
Response time trend graph—Shows changes of the response time of the Tomcat server over the
selected time period in a line graph. Hover the cursor over a spot in the curve to view the
response time at the specific time point. By default, the graph shows the last 1 hour data. To
change the report period, click the Last 1 Hour icon on the upper right of the graph, and
then select an icon from the list. Available options include Last 6 Hours , Today ,
Yesterday , This Week , This Month , and This Year .
Attribute/Value—Monitor index name and data.
Response Time—Round-trip response time of the Tomcat server in the last polling interval.
Traffic—Total number of bytes received and sent by the Tomcat server since the Tomcat server
started in the last polling interval.
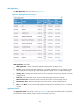
History icon —Click the History icon for a monitor index to view the history graph of the
response time or traffic trend. Hover the cursor over a spot on the curve to view the data at the
specific time point. Authorized users can view the statistics over the last 1 hour, last 6 hours,
today, yesterday, this week, this month, and this year by clicking the corresponding icons on the
upper right of the graph.
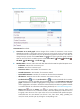
Memory Usage
The Memory Usage area layout is shown in Figure 221.