
HP Intelligent Management Center v5.2 Application Performance Manager Administrator Guide

283
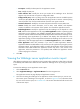
traffic. To change the report period, click the Last 1 Hour icon on the upper right of the graph,
and then select an icon from the list. Available options include Last 6 Hours , Today ,
Yesterday , This Week , This Month , and This Year . Hover the cursor over a spot on
the curve to view the application traffic at the specific time point. Click Rx or Tx to display or hide
the corresponding monitor index in the graph.
Attribute/Value—Monitor index name and data that was obtained when APM last polled the
Oracle AS.
Last Hour's Traffic—Total traffic sent and received by the Oracle AS over the last 1 hour.
Today's Traffic—Total traffic sent and received by the Oracle AS since 00:00 today.
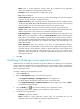
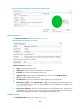
JVM Details
APM monitors the performance of the Java virtual machine (JVM) in which the Oracle AS is running and
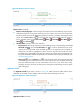
displays the monitoring details in the JVM Details area, as shown in Figure 232.
Figure 232 JVM Details area layout
JVM Details area fields:
Name—Name of the JVM.
Active Threads—Number of active threads of JVM in the last polling interval.
History icon —Click the History icon to view the changes of the number of active threads
of JVM in a line graph. Hover the cursor over a spot on the curve to view the data at the specific
time point. Authorized users can view statistics over the last 1 hour, last 6 hours, today,
yesterday, this week, this month, and this year by clicking the corresponding icons.
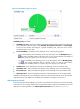
CPU Usage—CPU usage of the JVM in the last polling interval.
Set Threshold icon —Click the Set Threshold icon to set alarm thresholds for the CPU
usage of JVM. The CPU usage data is highlighted in orange when it reaches the level-1
threshold, and is highlighted in red when it reaches the level-2 threshold. Use either the global
thresholds or custom thresholds. For more information about threshold setting, see "Threshold
Management."
Heap Usage—Heap memory usage of JVM in the last polling interval.
JDBC Connections—Total number of open JDBC connections in the last polling interval.
Memory Usage—Physical memory used by the JVM in the last polling interval.
Active Sessions—Number of active sessions in the last polling interval.
Active Transactions—Number of active transactions in the last polling interval.
Start Time—Time when JVM last rebooted.
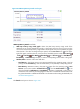
Web Application Details
The Web Application Details area displays information about 10 Web applications deployed on the
Oracle AS, as shown in Figure 233.