
HP Intelligent Management Center v5.2 Application Performance Manager Administrator Guide
287
Description—Modify the description for the application monitor.
Port—Modify the JMX port.
Traffic Collection Port—Modify the service port number of the WebLogic server. This field
appears only when at least one probe is configured for APM.
Polling Interval (min)—Select a polling interval for the application monitor. Available options
include 1, 2, 3, 4, 5, 10, 20, and 30. The default polling interval is 5 minutes. A shorter polling
interval provides more accurate real-time data consumes more system resources.
Username/Password—Modify the username and password used for remote JMX access.
Contact—Modify the contact information, such as name, email address, and telephone
number. The default is the username of the operator who created the application monitor.
Related Applications—Modify the applications that the WebLogic server depends on. Click
Add, and then select applications in the popup Select Applications window. Operating system
applications, such as Windows, AIX, FreeBSD, OpenBSD, HP-UX, Solaris, Mac OS, and Linux,
cannot be selected. APM automatically adds the dependencies between the WebLogic server
and operating system applications by IP address and displays their dependencies in the
application topology. To remove dependencies between the WebLogic server and one or more
applications, select the target applications in the Related Applications box and click Delete.
Detect Application—Select this parameter if you want to enable application detection.
Application detection enables APM to verify connection to the application by using the previous
parameter settings, and to determine whether to modify the application monitor based on the
verification result. APM modifies the application monitor only when it can connect to the
application. When this parameter is not specified, APM modifies the application monitor
without verifying the connection.
5. Click OK.
Viewing the WebLogic server application monitor report
After adding a WebLogic server application monitor, APM collects application index data to calculate
its availability and health status. Obtain monitor indexes for WebLogic server by viewing the monitor
report.
To access the WebLogic server application monitor report:
1. Click the Resource tab.
2. Select Application Manager > Application Monitor from the navigation tree.
The application monitor list page displays all application monitors.
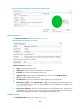
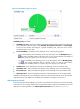
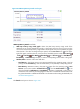
3. Click the link naming the WebLogic server application monitor whose report you want to view.
The monitor report of WebLogic server appears, as shown in Figure 235. For information about
the icons in the monitor report, see "2 Quick start." This section describes the fields in each area
of the monitor report.