
HP Intelligent Management Center v5.2 Application Performance Manager Administrator Guide

289
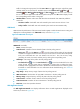
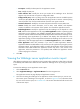
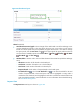
Figure 237 Availability Today area layout
Availability Today area fields:
Availability pie chart—Shows time duration percentages of the availability states for the WebLogic
server today. The availability states include Available, Unavailable, Inaccessible, and Unmanaged.
To view the time duration percentage of a specific availability state, Hover the cursor over the
corresponding slice in the chart.
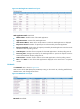
Current Availability—Availability of the WebLogic server in the last polling period.
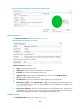
To view the availability of the WebLogic server in the last 7 days, click the Weekly History icon
. The weekly availability data is collected in hours. To view the time duration percentages of
availability states at a specific time, hover the cursor over that time.
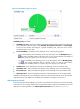
To view the availability of the WebLogic server in the last 30 days, click the Monthly History
icon . The monthly availability data is collected in days. To view the time duration
percentages of availability states on a specific day, hover the cursor over that day.
Available Time—Total available time duration of the WebLogic server since 00:00 today.
Unavailable Time—Total unavailable time duration of the WebLogic server since 00:00 today.
Inaccessible Time—Total inaccessible time duration of the WebLogic server since 00:00 today.
Unmanaged Time—Total unmanaged time duration of the WebLogic server since 00:00 today.
Availability time statistics of a new application monitor are collected since 00:00 on the day when the
application monitor was added. An availability time field does not appear if its value is 0.
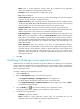
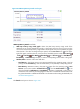
JVM Heap Memory Details
The normal operation of the WebLogic server relies on the performance of the Java virtual machine (JVM)
in which the server is running. APM monitors the JVM heap memory usage for the WebLogic server and
displays the monitoring details in the JVM Heap Memory Details area, as shown in Figure 238.