
HP Intelligent Management Center v5.2 Application Performance Manager Administrator Guide

22
Availability—Availability of the operating system of the host for the last poll query. The
availability can be (Available), (Unavailable), (Inaccessible), or (Unmanaged).
Move the pointer over the icon to view the availability represented by different colors for the last
hour.
Heath—Health status of the operating system on the host for the last poll query. The health status
can be (Healthy), (Minor), (Major), (Critical), or (Unknown). Health status
of the application for the last polling query. Move the pointer over the icon to view the health
status represented by different colors in the last hour.
Host Topology—Click the Host Topology icon to view the host and related monitored
applications in a topology view. For more information about the host topology, see "4 Topology
and application group management."
Application—Monitored applications on the host, except the operating system. Click an
application icon to view the monitoring report for the application.
4. Click Refresh to update the content of the Host Monitor List.
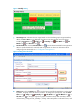
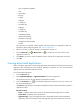
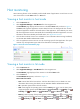
Figure 12 Host monitor list
Class monitoring
Class monitoring focuses on the health status of applications. Application types are defined in APM.
Every application type can have more than one application and the health status of the application
depends on the worst health status.
To view application monitors by class:
1. Click the Resource tab.
2. Select Application Manager > Class Monitor from the navigation tree.
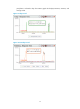
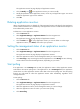
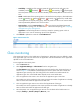
The Class Monitor page displays all application monitors based on their classes and types, as
shown in Figure 13. The leftmost column displays the monitor classes and other columns are
application types sorted by class. The background colors stand for the health status of the
application types. The overall health status depends on the worst health status.
3. Click an application class name to view the list of all application types in that class.
The numbers next to the application class name represents the number of applications in healthy
state out of the total number of applications for that class.
4. Click an application type name to view the list of all applications of that type.
The numbers next to the application class name represents the number of applications in healthy
state out of the total number of applications for that type.
5. Move the pointer over an application type name to view the details of the health status. For
example, Healthy: 1, Critical: 0, Major: 0, Minor: 0, --: 0.