
HP Intelligent Management Center v5.2 Application Performance Manager Administrator Guide

294
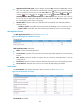
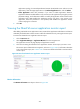
Name—Name of the servlet.
Invoke Count—Number of times that the servlet had been invoked since the WebLogic server
started until the last polling interval.
Average Duration—Average time taken by the servlet to respond to requests in the last polling
interval.
Path—Path of the servlet.
Servlet Capacity—Maximum capacity of the servlet in single-thread mode in the last polling
interval.
More—Click More to view information about all the servlets in a separate window.
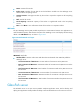
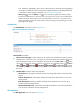
JMS Details
The Java Message Service (JMS) enables asynchronous communication between two applications or
within distributed systems. APM monitors the JMS of the WebLogic server and displays the monitoring
details in the JMS Details area, as shown in Figure 244.
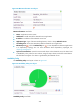
Figure 244 Servlet Details area layout
JMS Details area fields:
Attribute/Value—Monitor index name and data that was obtained when APM last polled the
WebLogic server.
Current Connections of JMS Server—Current number of connections to the JMS server.
Max. Connections of JMS Server—Maximum number of connections to the JMS server since the
last reset.
Total Connections of JMS Server—Total number of connections made to the JMS server since
the last reset.
Current Connections of JMS Service—Current number of connections to the JMS service.
Max. Connections of JMS Service—Maximum number of connections to the JMS service since
the last reset.
Total Connections of JMS Service—Total number of connections made to the JMS service since
the last reset
GlassFish server
The GlassFish server is an open source JaveEE5 compliant application server used to develop and
deploy Java applications. APM provides the ability to monitor GlassFish servers of versions 2.x and 3.x.