
HP Intelligent Management Center v5.2 Application Performance Manager Administrator Guide
295
Adding a GlassFish server application monitor
APM monitors GlassFish servers through JMX. When you add application monitors for GlassFish servers,
follow these guidelines:
Add the GlassFish server hosts to the IMC Platform so APM can obtain and display network
connections of the hosts and their access devices in the application topology. For more information
about adding hosts to the IMC Platform, see HP IMC Base Platform Administrator Guide.
Obtain the username and password used for remote JMX access so APM can obtain monitor index
data through JMX from the GlassFish server.
To view traffic statistics in the monitor report of the GlassFish server application, make sure at least
one probe is configured in APM. After a GlassFish server application monitor is added, APM sends
the IP address and service port of the monitored GlassFish server application to the probes for traffic
collection.
To add a GlassFish server application monitor:
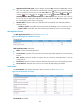
1. Click the Resource tab.
2. Enter the Add Application page in one of the following ways:
Select Application Manager > Add Application from the navigation tree.
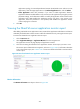
The page displays all application types that can be monitored by APM.
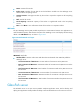
Select Application Manager > Application Monitor from the navigation tree, and click Add on
the application monitor list page.
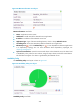
3. Click GlassFish Server of the Application Server Monitor class.
The page for adding a GlassFish server application monitor appears.
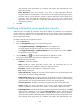
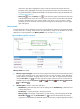
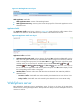
4. Configure the following parameters:
IP Address—Enter the IP address of the host on which the GlassFish server to be monitored
resides. If the host is already added to the IMC Platform, you can also click Select and select the
host in the Select Devices window. For information about selecting a host, see "2 Quick start."
APM automatically checks the specified IP address and associates the application monitor with
the host managed in the IMC Platform.
Name—Enter a unique application monitor name. HP recommends using Application
name_host IP address for naming the application monitor.
Description—Enter a description for the application monitor.
Port—Enter the JMX port.
Traffic Collection Port—Enter the service port number of the GlassFish server. This field appears
only when at least one probe is configured for APM.
Polling Interval (min)—Select a polling interval for the application monitor. Available options
include 1, 2, 3, 4, 5, 10, 20, and 30. The default polling interval is 5 minutes. A shorter polling
interval provides more accurate real-time data consumes more system resources.
Username/Password—Enter the username and password used for remote JMX access.
Contact—Enter contact information, such as name, email address, and telephone number. The
default is the username of the operator who created the application monitor.
Related Applications—Configure the applications that the GlassFish server depends on. Click
Add, and then select applications in the popup Select Applications window. Operating system
applications, such as Windows, AIX, FreeBSD, OpenBSD, HP-UX, Solaris, Mac OS, and Linux,
cannot be selected. APM automatically adds the dependencies between the GlassFish server