
HP Intelligent Management Center v5.2 Application Performance Manager Administrator Guide

302
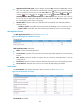
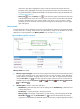
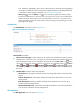
Figure 251 Web Application area layout
Web Application area fields:
Web Application Name—Name of the Web application.
Web Application Directory—Directory that locates the project file of the Web application on the
GlassFish server.
Application Traffic
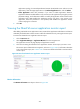
The Application Traffic area layout is shown in Figure 252. APM collects the traffic statistics of the
GlassFish server based on the IP address and port number of the GlassFish server host.
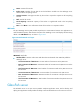
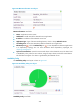
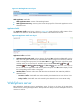
Figure 252 Application Traffic area layout
Application Traffic area fields:
Application Traffic trend graph—Shows changes of inbound (Rx) and outbound (Tx) traffic over the
last 1 hour. The green curve shows the inbound traffic and the orange curve shows the outbound
traffic. To change the report period, click the Last 1 Hour icon on the upper right of the graph,
and then select an icon from the list. Available options include Last 6 Hours , Today ,
Yesterday , This Week , This Month , and This Year . Hover the cursor over a spot on
the curve to view the application traffic at the specific time point. Click Rx or Tx to display or hide
the corresponding monitor index in the graph.
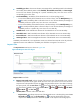
Attribute/Value—Monitor index name and data that was obtained when APM last polled the
GlassFish server.
Last Hour's Traffic—Total traffic sent and received by the GlassFish server over the last 1 hour.
Today's Traffic—Total traffic sent and received by the GlassFish server since 00:00 today.
WebSphere server
IBM WebSphere Application Server (WebSphere Server for short) is the basis of the IBM basic
infrastructure for running Web applications. APM provides the ability to monitor WebSphere servers of
versions 6.1 and 7.0.