
HP Intelligent Management Center v5.2 Application Performance Manager Administrator Guide

312
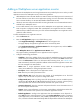
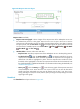
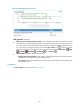
Figure 260 Transactions area layout
Transactions area fields:
Transactions trend graph—Shows changes of the numbers of global transactions, local
transactions, and active global transactions of the WebSphere server over the last 1 hour in a line
graph. Hover the cursor over a spot in the curve to view the transaction statistics at the specific time
point. To change the report period, click the Last 1 Hour icon on the upper right of the graph,
and then select an icon from the list. Available options include Last 6 Hours , Today ,
Yesterday , This Week , This Month , and This Year . Click Global Transactions, Local
Transactions, or Active Global Transactions to display or hide the corresponding monitor index in
the graph.
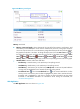
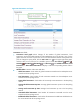
Attribute/Value—Monitor index name and data.
Global Transactions—Total number of global transactions started since the WebSphere server
started until the last polling interval.
Local Transactions—Total number of local transactions started since the WebSphere server
started until the last polling interval.
Active Global Transactions—Total number of concurrently active transactions in the last polling
interval.
Average Global Transaction Up Time—Average global transaction up time in the last polling
interval.
Average Local Transaction Up Time—Average local transaction up time in the last polling
interval.
Committed Global Transactions—Total number of transactions committed since the server
started until the last polling interval.
Rolled Back Global Transactions—Total number of transactions that had been rolled back since
the server started until the last polling interval.