
HP Intelligent Management Center v5.2 Application Performance Manager Administrator Guide

313
JDBC Connection Pool
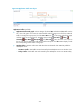
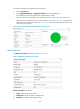
The JDBC Connection Pool area layout is shown in Figure 261.
Figure 261 JDBC Connection Pool area layout
JDBC Connection Pool area fields:
Trend graph—Shows changes of the numbers of created connections, closed connections, and
allocated connections in the JDBC connection pool over the last 1 hour in a line graph. Hover the
cursor over a spot in the curve to view the transaction statistics at the specific time point. To change
the report period, click the Last 1 Hour icon on the upper right of the graph, and then select an
icon from the list. Available options include Last 6 Hours , Today , Yesterday , This Week
, This Month , and This Year . Click Created Connections, Closed Connections, or
Allocated Connections to display or hide the corresponding monitor index in the graph.
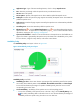
Attribute/Value—Monitor index name and data.
Created Connections—Total number of connections created since the WebSphere server
started until the last polling interval.
Closed Connections—Total number of connections closed since the WebSphere server started
until the last polling interval.
Pool Size—Size of the connection pool in the last polling interval.
Idle Connections—Total number of idle connections in the last polling interval.
Waiting Connections—Total number of connections in waiting state in the last polling interval.
Allocated Connections—Total number of allocated connections in the last polling interval.
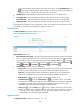
Application Traffic
The Application Traffic area layout is shown in Figure 262. APM collects the traffic statistics of the
WebSphere server based on the IP address and port number of the WebSphere server host.