
HP Intelligent Management Center v5.2 Application Performance Manager Administrator Guide

331
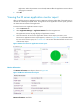
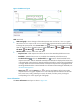
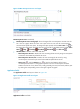
Figure 276 Non-Anonymous Access area layout
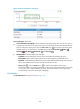
Non-Anonymous Access area fields:
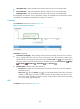
Non-Anonymous Access trend graph—Shows changes of the non-anonymous accesses over the
last 1 hour in a graph. Hover the cursor over a spot on the curve to view the non-anonymous
accesses at the specific time point. To change the report period, click the Last 1 Hour icon on
the upper right of the graph, and then select an icon from the list. Available options include Last 6
Hours , Today , Yesterday , This Week , This Month , and This Year .
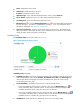
Attribute/Value—Monitor index name and data.
Non-Anonymous Accesses—Number of users accessing the IIS server by using non-anonymous
connections when APM last polled the IIS server.
Non-Anonymous Accesses/Sec—Number of users accessing the IIS server by using
non-anonymous connections per second when APM last polled the IIS server.
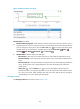
History icon —Click the History icon to view the trend statistics of the history
non-anonymous accesses in a line graph. Operators can view non-anonymous accesses
statistics over the last 1 hour, last 6 hours, today, yesterday, this week, this month, and this year
by clicking the corresponding icons on the upper right of the graph.
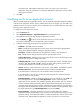
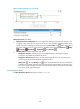
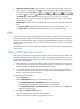
Application Traffic
The Application Traffic area layout is shown in Figure 276.
Figure 277 Application Traffic area layout
Application Traffic area fields: