
HP Intelligent Management Center v5.2 Application Performance Manager Administrator Guide

334
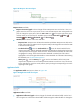
Name—Modify the unique application monitor name. HP recommends using Application
name_host IP address format for naming the application monitor.
Description—Enter a description for the application monitor to aid maintenance.
Port—Enter the Web service port number, which is 80 by default.
Traffic Collection Port—Modify the service port number for the PHP server. This field appears
only when at least one probe is configured for APM.
Polling Interval (min)—Select a polling interval for the application monitor. Available options
include 1, 2, 3, 4, 5, 10, 20, and 30 in minutes. A shorter polling interval provides more
accurate real-time data, but consumes more system resources.
Relative Path—Enter the relative path of the PHP page, which starts with a slash (/). The URL of
a PHP page is in the format of http://+<IP address>+relative path, for example,
http://10.154.240.55/index.php, where the relative path is /index.php.
Contact—Enter the contact information, such as name, email address, and telephone number.
Related Application—Modify the applications that the PHP server depends on. Click Add, and
then select applications in the popup Select Applications window. Operating system
applications, such as Windows, AIX, FreeBSD, OpenBSD, HP-UX, Solaris, Mac OS, and Linux,
cannot be selected. APM automatically adds the dependencies between the PHP server and
operating system applications by IP address and displays their dependencies in the application
topology. To remove dependencies between the PHP server and one or more applications,
select the target applications in the Related Applications box and click Delete.
Detect Application—Select this parameter if you want to enable application detection.
Application detection enables APM to verify connection to the application by using the previous
parameter settings, and to determine whether to modify the application monitor based on the
verification result. APM modifies the application monitor only when it can connect to the
application. When this parameter is not selected, APM modifies the application monitor without
verifying the connection.
4. Click OK.
Viewing the PHP application monitor report
After you add the PHP application monitor, APM starts collecting index data of the application to
calculate its availability and health status. Through the PHP application monitor report, operators can
obtain monitor indexes of the application.
To access the PHP application monitor report:
1. Click the Resource tab.
2. Select Application Manager > Application Monitor from the navigation tree.
The application monitor list page displays all application monitors.
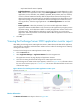
3. Click the name link of a PHP application monitor whose report you want to view.
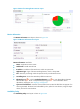
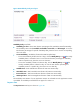
The PHP application monitor report appears, as shown in Figure 278. For information about the
icons in the monitor report, see "2 Quick start." This section describes the fields in each area of the
monitor report.