
HP Intelligent Management Center v5.2 Application Performance Manager Administrator Guide

349
ES
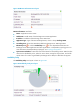
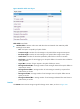
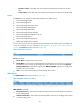
The ES area displays the number of notifications to be processed when APM last polled Exchange Server
2003, as shown in Figure 293.
Figure 293 ES area layout
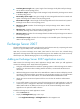
MTA Statistics
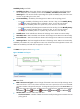
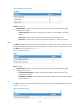
The MTA Statistics area monitors operation of the Message Transport Agent (MTA) of Exchange Server
2003. The MTA Statistics area layout is shown in Figure 294.
Figure 294 MTA Statistics area layout
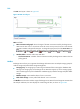
MTA Statistics area fields:
Attribute/Value—Monitor index name and data that was obtained when APM last polled
Exchange Server 2003.
Working Queue Length—Number of mail messages that have not been processed by MTA in
the working queue.
Bytes/Min—Number of bytes of mail messages processed by MTA per minute.
Bytes Received/Min—Number of bytes received by MTA through TCP/IP connections per
minute.
Bytes Sent/Min—Number of bytes sent by MTA through TCP/IP connections per minute.
Recipient Queues—Total number of recipients of all mail messages in MTA.
Working Queue Bytes—Total number of bytes of all mail messages in MTA.
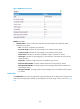
TD Statistics
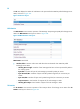
The TD Statistics area monitors operation of the transport driver of Exchange Server 2003. The TD
Statistics area layout is shown in Figure 295.