
HP Intelligent Management Center v5.2 Application Performance Manager Administrator Guide

350
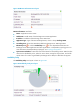
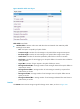
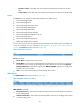
Figure 295 TD Statistics area layout
TD Statistics area fields:
Attribute/Value—Monitor index name and data that was obtained when APM last polled
Exchange Server 2003.
Message to Send—Number of mail messages delivered to the message database (MDB). MDB
is a database instance of Exchange Server 2003. MDB can be identified as mailbox or public
folder storage based on the stored data type.
Message from MTA to IS—Number of mail messages delivered from MTA to information
storage (IS).
Message from IS to MTA—Number of mail messages delivered from IS to MTA.
Host Cache Hits—Number of cache hits.
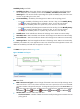
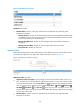
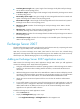
Application Traffic
APM collects Exchange Server 2003 traffic based on the IP address of the host and the traffic collection
port used by the application. The Application Traffic area layout is shown in Figure 40.
Figure 296 Application Traffic area layout
Application Traffic area fields:
Application Traffic trend graph—Shows changes of inbound and outbound traffic over the last 1
hour. The green curve shows the inbound traffic and the orange curve shows the outbound traffic.
To change the report period, click the Last 1 Hour icon on the upper right of the graph, and then
select an icon from the list. Available options include Last 6 Hours , Today , Yesterday ,
This Week , This Month , and This Year . Hover the cursor over a spot on the curve to view
the application traffic at the specific time point. Click Rx or Tx to display or hide the corresponding
monitor index in the graph.
Attribute/Value—Monitor index name and data that was obtained when APM last polled
Exchange Server 2003.