
HP Intelligent Management Center v5.2 Application Performance Manager Administrator Guide

402
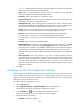
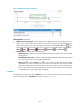
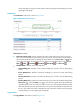
Figure 341 Copy Statistics area layout
Copy Statistics area fields:
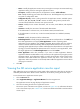
Inbound/Outbound object trend graph—Shows changes of the number of inbound/outbound
objects per second over the last 1 hour in a line chart. Hover the cursor over a spot on the curve to
view the number of inbound/outbound objects per second at the specific time point. To change the
report period, click the Last 1 Hour icon on the upper right of the graph, and then select an icon
from the list. Available options include Last 6 Hours , Today , Yesterday , This Week
, This Month , and This Year .
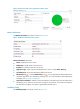
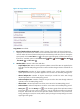
Attribute/Value—Monitor index name and data.
Copied Objects/Sec—Rate at which replication updates received from ADs are applied by the
local AD in the last APM polling period. This counter excludes changes that are received but not
applied.
Left Objects/Sec—Number of object updates received in the current directory replication
update packet that have not yet been applied to the local AD in the last APM polling period.
Inbound Objects/Sec—Number of objects received per second from other ADs through
inbound replication in the last APM polling period.
Outbound Objects/Sec—Number of objects sent per second to other ADs through outbound
replication in the last APM polling period.
Inbound Rate—Inbound replication rate of the current AD in the last APM polling period.
Outbound Rate—Outbound replication rate of the current AD in the last APM polling period.
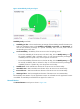
History icon —Click the History icon to view the history graph of the replication statistics
trend. Hover the cursor over a spot on the curve to view the replication statistics at the specific
time point. Authorized users can view the replication statistics over the last 1 hour, last 6 hours,
today, yesterday, this week, this month, and this year by clicking the corresponding icons on the
upper right of the graph.