
HP Intelligent Management Center v5.2 Application Performance Manager Administrator Guide

484
Excel Calculation Services
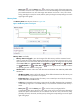
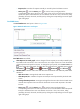
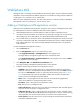
The Excel Calculation Services area layout is shown in Figure 405.
Figure 405 Excel Calculation Services area layout
Excel Calculation Services area fields:
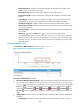
Excel Calculation Services trend graph—Shows changes of sessions opened per second in Excel
calculation services and active requests received per second by Excel calculation services over the
last 1 hour. Hover the cursor over a spot on the curve to view the number of sessions or requests at
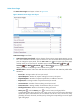
the specific time point. To change the report period, click the Last 1 Hour icon on the upper right
of the graph, and then select an icon from the list. Available options include Last 6 Hours , Today
, Yesterday , This Week , This Month , and This Year . Click the legend names to
display or hide the corresponding monitor indexes in the graph.
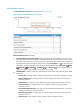
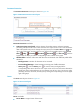
Attribute/Value—Monitor index name and data that was obtained when APM last polled Office
SharePoint.
Sessions/Sec—Average number of sessions opened per second by Excel calculation services.
Received Requests/Sec—Average number of active requests received per second by Excel
calculation services.
Active Requests—Number of active requests being processed by Excel calculation services.
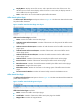
Error Requests/Sec—Average number of error requests returned per second by Excel
calculation services.
Cached Charts Requested/Sec—Average times of requested charts obtained per second from
cached charts by Excel calculation services.
Reports Requested/Sec—Average number of report requests received per second by Excel
calculation services.
Active Sessions—Total number of active sessions in Excel calculation services.