
HP Intelligent Management Center v5.2 Application Performance Manager Administrator Guide

488
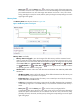
Active Server Pages
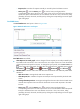
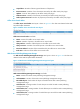
The Active Server Pages area layout is shown in Figure 409.
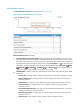
Figure 409 Active Server Pages area layout
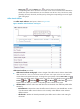
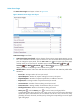
Active Server Pages area fields:
Active Server Pages trend graph—Shows changes of Active Server Pages (ASP) statistics over the
last 1 hour. Hover the cursor over a spot on the curve to view the monitor data at the specific time
point. To change the report period, click the Last 1 Hour icon on the upper right of the graph,
and then select an icon from the list. Available options include Last 6 Hours , Today ,
Yesterday , This Week , This Month , and This Year . Click the legend names to
display or hide the corresponding monitor indexes in the graph.
Attribute/Value—Monitor index name and data that was obtained when APM last polled Office
SharePoint.
Errors/Sec—Average number of errors per second.
Queued Requests—Number of requests waiting for services in the queue.
Rejected Requests—Number of requests rejected due to insufficient resources.
Requests/Sec—Average number of requests executed per second.
Current Sessions—Number of sessions being served per second.
Transactions/Sec—Average number of transactions starts per second.
Pending Transactions—Number of transactions being processed.
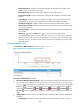
History icon —Click the History icon to view the history trend graph of the
corresponding index. Hover the cursor over a spot on the curve to view the monitor data at the
specific time point. Authorized users can view statistics over the last 1 hour, last 6 hours, today,
yesterday, this week, this month, and this year by clicking the corresponding icons on the upper
right of the graph.