
HP Intelligent Management Center v5.2 Application Performance Manager Administrator Guide

508
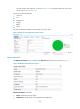
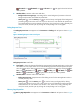
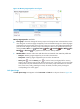
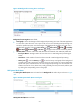
Figure 431 Memory Page Dispatcher area layout
Memory Page Dispatcher area fields:
Trend graph—Shows the changes of memory swap-in and swap-out rates on the SAP host in a line
chart. The green curve shows pages swapped in per second and the orange curve shows the pages
swapped out per second. Hover the cursor over a spot on a curve to view data at the specific time
point. View the changes of memory swap-in and swap-out rates over a specified time period by
clicking the Last 1 Hour icon , Last 6 Hours , Today , Yesterday , This Week , This
Month , or This Year . The graph shows the last hour data by default.
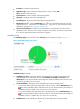
Attribute/Value—Monitor index name and data that was obtained when APM last polled SAP.
Swap Ins—Memory pages swapped in per second on the SAP host.
Swap Outs—Memory pages swapped out per second on the SAP host.
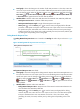
History icon —Click the History icon to view the history trend graph of the memory
swap-in rate or memory swap-out rate. Hover the cursor over a spot on the curve to view data
at the specific time point. Authorized users can view memory swap rate statistics over the last 1
hour, last 6 hours, today, yesterday, this week, this month, and this year by clicking the
corresponding icons on the graph.
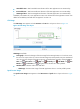
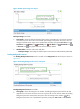
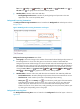
Disk Space Usage
The Disk Space Usage area appears on both Overview and OS tabs. Its layout is shown in Figure 432.