
HP Intelligent Management Center v5.2 Application Performance Manager Administrator Guide

519
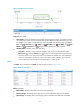
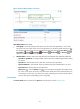
Host Spool List area fields:
Trend graph—Shows the changes of the space usage in the host spool list of the SAP application
in a line chart. Hover the cursor over a spot on the curve to view the space usage in the host spool
list at the specific time point. View the changes of the space usage in the host spool list over a
specified time period by clicking the Last 1 Hour icon , Last 6 Hours , Today , Yesterday
, This Week , This Month , or This Year . The graph shows the last hour data by default.
Attribute/Value—Monitor index name and data.
Host Spool List—Used space in the host spool list as a percentage when APM last polled SAP.
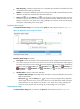
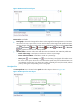
History icon —Click the History icon to view the history trend graph of the space usage
in the host spool list. Hover the cursor over a spot on the curve to view the space usage in the
host spool list at the specific time point. Authorized users can view space usage statistics for the
host spool list over the last 1 hour, last 6 hours, today, yesterday, this week, this month, and this
year by clicking the corresponding icons on the graph.