
HP Intelligent Management Center v5.2 Application Performance Manager Administrator Guide

58
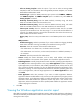
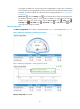
Memory Usage Ratio dashboard or trend graph—View the area in a dashboard or a trend graph.
Click the Dashboard icon or Trend icon on the top right corner to switch between the
graphs.
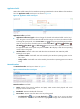
Dashboard graph—Shows the transient memory usage of the Windows operating system in the
last polling period.
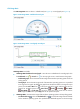
Trend graph—Shows the memory usage trend of the Windows operating system over the last 1
hour. The green curve represents the physical memory and the orange curve represents the
virtual memory. Hover the cursor over a spot on the curve to view the memory usage of the
Windows operating system at the specific time point. To change the report period, click the Last
1 Hour icon on the upper right of the graph, and then select an icon from the list. Available
options include Last 6 Hours , Today , Yesterday , This Week , This Month ,
and This Year . Click Physical Memory Usage Ratio or Virtual Memory Usage Ratio to
display or hide the corresponding monitor index in the graph.
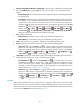
Item—Monitor index name.
Physical Memory—Physical memory usage on the Windows operating system.
Virtual Memory—Virtual memory usage on the Windows operating system.
Total—Total physical or virtual memory capacity on the Windows operating system.
In Use—Physical or virtual memory size in use on the Windows operating system.
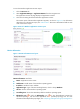
History icon —Click the History icon for a monitor index to view statistics of the history
physical or virtual memory usage trend for the Windows operating system in a line graph. By
default, the graph shows the last hour statistics. To change the report period, click the Last 6
Hours icon , Today icon , Yesterday icon , This Week icon , This Month icon ,
or This Year icon on the upper right of the graph as needed.
Usage Ratio—Physical or virtual memory usage of the Windows operating system. The value is a
percentage of the memory size in use to the total memory capacity.
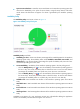
Set Threshold icon —Click the Set Threshold icon for a monitor index to set alarm
thresholds for the physical or virtual memory usage. The usage ratio is highlighted in orange
when it reaches the level-1 threshold, and is highlighted in red when it reaches the level-2
threshold. Use either the global thresholds or custom thresholds. For more information about
setting thresholds, see "5 Configuration management."
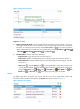
History icon —Click the History icon for a monitor index to view statistics of the history
physical or virtual memory usage ratios for the Windows operating system. By default, the
graph shows the last hour statistics. To change the report period, click the Last 6 Hours icon
, Today icon , Yesterday icon , This Week icon , This Month icon , or This Year
icon on the upper right of the graph as needed.
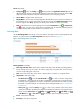
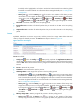
Ping Test
APM pings the Windows host every polling interval. In a ping test, APM sends out up to three ICMP
packets to the host. When it receives a response, APM considers the ping test a success and records the
response time. When it receives no response after sending out all ICMP packets, APM considers the ping
test a failure. The Ping Test area layout is shown in Figure 17.