
HP Intelligent Management Center v5.2 Application Performance Manager Administrator Guide

79
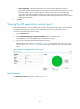
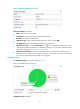
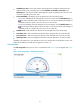
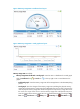
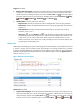
Figure 35 Memory Usage Ratio—Dashboard area layout
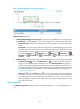
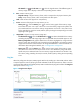
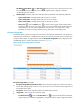
Figure 36 Memory Usage Ratio—Trend graph area layout
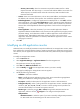
Memory Usage Ratio area fields:
Memory Usage Ratio dashboard or trend graph—View the area in a dashboard or a trend graph.
Click the Dashboard icon or Trend icon on the top right corner to switch between the
graphs.
Dashboard graph—View the memory usage ratio of the AIX application in the last APM polling
period.
Trend graph—View the changes of the memory usage ratio (including the physical memory
usage ratio and swap memory usage ratio) for the AIX application in a line chart. The green line
is for the physical memory usage ratio and the orange for the swap memory usage ratio. Hover
the cursor over a spot on the curve to view the memory usage ratio at the specific time point.
View the changes of the memory usage ratio over a specified time period by clicking the Last 1
hour icon , Last 6 hours icon , Today icon , Yesterday icon , This Week icon ,