
HP Intelligent Management Center v5.2 Application Performance Manager Administrator Guide

81
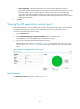
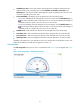
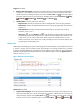
Ping Test area fields:
Response Time trend graph—Shows the trend of the round trip response time of the AIX application
over the last 1 hour. Hover the cursor over a spot on the curve to view the response time at the
specific time point. To change the report period, click the Last 1 Hour icon on the upper right of
the graph, and then select an icon from the list. Available options include Last 6 Hours , Today
, Yesterday , This Week , This Month , and This Year .
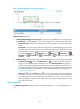
Attribute/Value—Monitor index name and data.
Response Time—Round trip response time of the AIX application in the last ping operation.
Packets Sent—Number of ICMP packets that are sent in the last ping operation. The maximum
number is 3.
Packets Received—Number of ICMP response packets that are received in the last ping
operation, which is 0 or 1.
History icon —Click the History icon to view the history trend graph of the ping test data
(including the response time, the packets sent, and the packets received). Hover the cursor over
a spot on the curve to view the data at the specific time point. Authorized users can view
statistics over the last 1 hour, last 6 hours, today, yesterday, this week, this month, and this year
by clicking the corresponding icons.
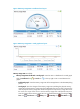
System Load
APM analyzes and displays the system load average for the monitored AIX in the specified time period
(1 minute, 5 minutes, and 15 minutes). System load average is the average number of the processes
running on the AIX system during a specified time period. Excessive system load can cause performance
problems and the thresholds of system load vary across different types of CPU. The System Load area
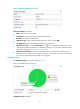
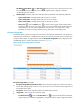
layout is shown in Figure 38.
Figure 38 System Load area layout
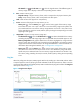
System Load area fields:
System Load trend graph—Shows the system load trend of AIX over the last 1 hour. The green curve
shows the system load over 1 minute, the orange over 5 minutes, and the blue over 15 minutes. To
change the report period, click the Last 1 Hour icon on the upper right of the graph, and then
select an icon from the list. Available options include Last 6 Hours , Today , Yesterday ,