
HP Intelligent Management Center v5.2 Application Performance Manager Administrator Guide

82
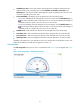
This Week , This Month , and This Year . Hover the cursor over a spot on the curve to view
the system load at the specific time point. Click the legend names to display or hide the
corresponding monitor indexes.
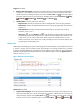
Attribute/Value—Monitor index name and data that was obtained when APM last polled AIX.
System Load/1 Min—Average system load over the last 1 minute.
System Load/5 Min—Average system load over the last 5 minutes.
System Load/15 Min—Average system load over the last 15 minutes.
History icon —Click the History icon to view the history graph of the average system
load trend. Hover the cursor over a spot on the curve to view the data at the specific time point.
Authorized users can view system load statistics over the last 1 hour, last 6 hours, today,
yesterday, this week, this month, and this year by clicking the corresponding icons.
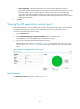
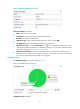
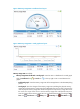
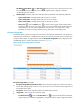
File System Usage Ratio
The AIX file directory structure contains one root directory and multiple subdirectories. File systems are
mounted to the root directory or subdirectories under the root directory. Each file system corresponds to
a physical disk partition or logical volume. Use the File System Usage Ratio area to display how the
available disk space is used. Its area layout is shown in Figure 39.
Figure 39 File System Usage Ratio area layout
File System Usage Ratio area fields:
File System Usage Ratio horizontal bar chart—Shows the space usage ratio of each mount point in
the last APM polling period. Hover the cursor over a spot in a bar to view the space usage ratio of
the specified mount point.
File System—Mount point of the file system in the AIX directory structure.
Usage Ratio—Space usage ratio of the file system.
Set Threshold icon —Click the Set Threshold icon to set alarm thresholds for the AIX file
system usage ratio. The data is highlighted in orange when the file system usage ratio reaches