
HP Intelligent Management Center v5.2 Application Performance Manager Administrator Guide

84
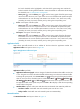
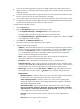
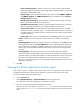
Figure 41 Network Interface area layout
Network Interface area fields:
Name—Identifier of a network interface card in AIX. APM monitors both physical and virtual
(logical) network interface cards.
Receive Rate—Receive rate of a network interface card in the last APM polling period.
Set Threshold icon —Click the Set Threshold icon to set alarm thresholds for the receive
rate of AIX network interface cards. The data is highlighted in orange when the receive rate
reaches the level-1 threshold, and is highlighted in red when the receive rate reaches the level-2
threshold. Use the global thresholds or custom thresholds. For information about setting the
thresholds, see "5 Configuration management."
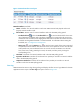
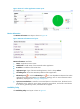
History icon —Click the History icon to view the history graph of the receive rate trend
of a specified network interface card. Hover the cursor over a spot on the curve to view the data
at the specific time point. Authorized users can view the receive rate statistics over the last 1
hour, last 6 hours, today, yesterday, this week, this month, and this year by clicking the
corresponding icons.
Send Rate—Send rate of a network interface card in the last APM polling period.
Input Error Packet Loss—Number of lost inbound error packets per second on a network interface
card in the last APM polling period.
Output Error Packet Loss—Number of lost outbound error packets per second on a network
interface card in the last APM polling period.
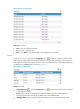
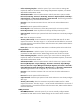
Error Log
APM examines the AIX error logs during polling and displays the first 10 error logs obtained in the AIX
application monitor report. The Error Log area layout is shown in Figure 42.