
HP Intelligent Management Center v7.0 VAN Fabric Manager Administrator Guide
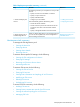

3. Click Delete.
4. Click OK.
Monitoring traffic size
Traffic charts are available for you to monitor the traffic size changes over a period of time for
internal interfaces and transport-facing interfaces.
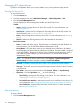
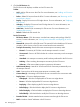
To monitor the traffic size on a device:
1. Click the Service tab.
2. From the navigation tree, select VAN Fabric Manager > LAN Configuration > EVI.
3. Click the Device Management tab.
4. In the device list, click the Operation icon for the device, and then select View Traffic Info.
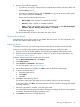
The traffic information page displays two charts:
• Transport-facing Traffic—Displays the trend of EVI tunneled traffic. Click the Last Hour,
Last Day, Last Week, Last Month, Last Year, or Custom Time Range link to view the traffic
chart for the selected time range.
• Top 5 Internal Interfaces by Traffic Size—Displays the top 5 internal interfaces according
to its traffic size.
Managing EVI services
EVI service management provides unified planning, deployment, and management to EVI services
and edge devices. To tune EVI settings on individual devices, see "Managing EVI settings on
individual devices."
Viewing the EVI service list
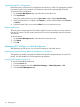
To view the EVI service list:
1. Click the Service tab.
2. From the navigation tree, select VAN Fabric Manager > LAN Configuration > EVI.
Managing EVI services 119