
HP Intelligent Management Center v7.0 VAN Fabric Manager Administrator Guide

4 Viewing the At a Glance page
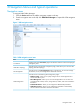
The At a Glance page displays a variety of statistics about VFM network resources in pie charts,
column charts, and line charts.
Accessing the At a Glance page
To access the At a Glance page:
1. Click the Service tab.
2. From the navigation tree, select VAN Fabric Manager > At a Glance.
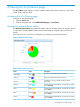
Viewing the network device status
The Network Device Status area displays the states and port utilization rate for all network devices
in a pie chart. The port utilization rate shows the percentage of occupied ports on all network
devices.
Move the cursor over a pie slice to display the port utilization rate of network devices.
Figure 2 Network device status
Table 2 Device status and colors
DescriptionColorStatus
The device is not added to the IMC Platform.
Gray
Unmanaged
VFM cannot obtain the state of the device.
Blue
Unknown
The device is running correctly and has no alarms
generated.
Green
Normal
The device has generated alarms, of which the worst alarm
level is Warning.
Cyan
Warning
The device has generated alarms, of which the worst alarm
level is Minor.
Yellow
Minor
The device has generated alarms, of which the worst alarm
level is Major.
Orange
Major
The device has generated alarms, of which the worst alarm
level is Critical.
Red
Critical
Accessing the At a Glance page 19