
HP Intelligent Management Center v7.0 VAN Fabric Manager Administrator Guide
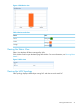


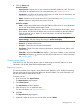

Move the cursor over one of the time node on the chart to display the EVI service name, time, and
numbers for this migration.
Hide the VM migration information for an EVI service by clicking its name at the bottom of the
chart. Click the EVI service name again to redisplay its migration information.
Figure 8 Top 5 EVI services by VM migration/24 hours
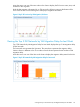
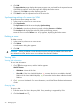
Viewing the Top 5 EVI Networks by VM Migration Delay for Last Week
Top 5 EVI Networks by VM Migration Delay for Last Week displays the top 5 VM migration delay
for the last week.
The horizontal axis represents the VM name. The vertical axis represents the migration delay.
VMs are shown in different colors. The number of each column reprents the real number of VM
migration delay.
Move the cursor over one of the VMs on the chart to display the migration delay status for this VM.
Figure 9 Top 5 EVI networks by VM migration delay for last week
Viewing the Top 5 EVI Networks by VM Migration Delay for Last Week 23