
HP Insight Cluster Management Utility v7.1 User Guide
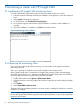
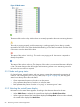
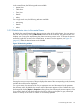
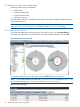

Figure 32 Node status
The status of this node is okay. Node values are correctly reported to the main monitoring daemon.
The node is pinging properly, and the monitoring is working properly, but an alert is currently
reported for this node. One of the thresholds defined by you has been exceeded. Click the node
in the tree to view the detail of this alert.
The status of this node is "No Ping". This node is not pinging at all. User action is required to
identify the problem.
The status of this node is unknown. The daemon of this node is not monitored because it failed or
is late. This state changes when HP Insight CMU monitoring selects a new monitoring server for
this node. No user action is required.
5.3.1 Node and group status
For logical groups, network entities, and user groups, a status bar represents the proportion of
nodes in "OK" state (green) and "no ping" state (red). In Figure 32 (page 68), the red/green
status bar at the top shows the node status.
• Green represents the portion of nodes in an okay status.
• Grey represents the portion of nodes in an unknown state.
• Red represents the portion of nodes in “no ping” or “monitoring error” state.
5.3.2 Selecting the central frame display
Information in the central frame appears according to the elements selected in the tree.
• When CMU Cluster is selected, the central frame displays the Global Cluster View.
• When a group is selected, the central frame displays the Group View. When a node is selected,
the central frame displays the Node View.
68 Monitoring a cluster with HP Insight CMU