
HP Integrity iLO 3 Operations Guide
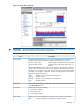
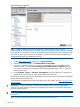
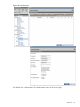
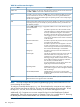

Figure 26 Power Meter Readings
IMPORTANT: Power consumption data readings are dependent on the configuration, architecture,
components, and levels of activity of the server at any given time.
Table 21 Power Meter Readings description
DescriptionItem
The graphs display recent server power usage. The graph data is reset whenever the
iLO MP is reset. Samples are taken in 5 minute and 10 second time increments.
History Graphs
24-Hour History Graph 24-hour display with samples taken every 5 minutes.
20-Minute History Graph 20-minute display with samples taken every 10
seconds.
Each sample includes the power usage, power regulator mode, temperature, and time
stamp of when the sample was taken. You can display this information by positioning
the mouse over a sample on each graph. The peak, average, and cap samples display
by default. You can display or hide peak, average, and cap samples on the graphs by
toggling the appropriate checkbox.
Peak Samples are red and appear in the background.
Average Samples are blue.
Minimum Samples are gray and appear in the foreground.
Cap Samples are black.
You can display the samples in either watts or Btu/hr by selecting the appropriate units
in the Show values in menu.
Power Units
Displays the current power readings.Current State
• Present Power Reading
• Present Power Cap
• Power Regulator Mode
Displays power history collected in 5 minute, 20 minute, and 24 hour increments.Power History
Peak Displays the highest power usage of the samples collected.
Web GUI 93