HP Code Coverage Tool Reference Manual for HP Integrity NonStop NS-Series Servers Abstract This manual describes the Code Coverage Tool for HP Integrity NonStop NS-Series servers. It addresses application developers who use C/C++, pTAL, or COBOL to create application components for NonStop servers, and who wish either to evaluate the code coverage provided by test cases or to understand what parts of an application are used, or most heavily used, under a representative workload.
Document History Part Number Product Version Published 542684-001 Code Coverage Tool H06 August 2006 542684-004 Code Coverage Tool H06 August 2012
Legal Notices © Copyright 2012 Hewlett-Packard Development Company, L.P. Legal Notice Confidential computer software. Valid license from HP required for possession, use or copying. Consistent with FAR 12.211 and 12.212, Commercial Computer Software, Computer Software Documentation, and Technical Data for Commercial Items are licensed to the U.S. Government under vendor’s standard commercial license. The information contained herein is subject to change without notice.
HP Code Coverage Tool Reference Manual for HP Integrity NonStop NS-Series Servers Glossary Index Figures Tables Legal Notices What’s New in This Manual v Manual Information v New and Changed Information v About This Manual vii Notation Conventions vii HP Encourages Your Comments xi 1. Introduction to the HP Code Coverage Tool Features of the Tool 1-1 Required Hardware and Software Usage Overview 1-2 Topics This Manual Covers 1-5 1-2 2.
4. Running the Application Contents 4. Running the Application Task Overview 4-1 Prepare the Application for Testing 4-1 Preparing Test Cases 4-1 Insulating the Application 4-1 Run the Application 4-2 Verify Output 4-2 Example 4-2 5.
. Interpreting the Code Coverage Report Contents 7. Interpreting the Code Coverage Report Opening the Code Coverage Report 7-1 Code Coverage Display for a Source File 7-1 Execution Counts in the Source Display 7-2 Representation of #include Files 7-3 Understanding Color Coding in the Code Coverage Report 7-4 8. Usage Scenario Build the Application 8-3 Run the Application 8-4 Produce the DPI File 8-4 Measure Code Coverage 8-5 Evaluate the Code Coverage Report 8-5 9.
Contents HP Code Coverage Tool Reference Manual for HP Integrity NonStop NS-Series Servers—542684-004 iv
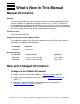
What’s New in This Manual Manual Information HP Code Coverage Tool Reference Manual for HP Integrity NonStop NS-Series Servers Abstract This manual describes the Code Coverage Tool for HP Integrity NonStop NS-Series servers.
What’s New in This Manual New and Changed Information HP Code Coverage Tool Reference Manual for HP Integrity NonStop NS-Series Servers—542684-004 vi
About This Manual Notation Conventions Hypertext Links Blue underline is used to indicate a hypertext link within text. By clicking a passage of text with a blue underline, you are taken to the location described. For example: This requirement is described under Backup DAM Volumes and Physical Disk Drives on page 3-2. General Syntax Notation This list summarizes the notation conventions for syntax presentation in this manual. UPPERCASE LETTERS.
About This Manual General Syntax Notation each side of the list, or horizontally, enclosed in a pair of brackets and separated by vertical lines. For example: FC [ num ] [ -num ] [ text ] K [ X | D ] address { } Braces. A group of items enclosed in braces is a list from which you are required to choose one item. The items in the list can be arranged either vertically, with aligned braces on each side of the list, or horizontally, enclosed in a pair of braces and separated by vertical lines.
Notation for Messages About This Manual Line Spacing. If the syntax of a command is too long to fit on a single line, each continuation line is indented three spaces and is separated from the preceding line by a blank line. This spacing distinguishes items in a continuation line from items in a vertical list of selections. For example: ALTER [ / OUT file-spec / ] LINE [ , attribute-spec ]… !i and !o.
About This Manual Change Bar Notation lowercase italic letters. Lowercase italic letters indicate variable items whose values are displayed or returned. For example: p-register process-name [ ] Brackets. Brackets enclose items that are sometimes, but not always, displayed. For example: Event number = number [ Subject = first-subject-value ] A group of items enclosed in brackets is a list of all possible items that can be displayed, of which one or none might actually be displayed.
About This Manual HP Encourages Your Comments The message types specified in the REPORT clause are different in the COBOL85 environment and the Common Run-Time Environment (CRE). The CRE has many new message types and some new message type codes for old message types. In the CRE, the message type SYSTEM includes all messages except LOGICAL-CLOSE and LOGICAL-OPEN. HP Encourages Your Comments HP encourages your comments concerning this document.
About This Manual HP Encourages Your Comments HP Code Coverage Tool Reference Manual for HP Integrity NonStop NS-Series Servers—542684-004 xii
1 Introduction to the HP Code Coverage Tool This manual describes the Code Coverage Tool for HP Integrity NonStop NS-series servers. It addresses application developers who use C/C++, pTAL, or COBOL to create application components for NonStop Servers, and who wish either to evaluate the code coverage provided by test cases or to understand what parts of an application are used, or most heavily used, under a representative workload.
Introduction to the HP Code Coverage Tool Required Hardware and Software Required Hardware and Software The Code Coverage Tool includes two products T0746: Code Cover Utility (codecov) T0747: Profile Merge Utility (profmrg) and support for code-coverage instrumentation in H06.
Introduction to the HP Code Coverage Tool Usage Overview 5. Evaluate the report, and take any appropriate action. Figure 1-1 illustrates these steps.
Usage Overview Introduction to the HP Code Coverage Tool Figure 1-1. Code Coverage Task Overview Source Files 1. Compile the application. Compiler (pTAL, COBOL, C/C++) Static Profiling Information (SPI) Files Instrumented Object Files 2. Run the application. 4a. Concatenate SPI files. Guardian, OSS Platform Text Editor Raw Data Files 3. Merge raw data. profmrg Dynamic Profiling Information (DPI) File 4. Generate code coverage report.
Introduction to the HP Code Coverage Tool Topics This Manual Covers Topics This Manual Covers The rest of this manual provides Instructions for installing the Code Coverage Tool on a workstation Instructions for creating instrumented object files and SPI files from source programs in C/C++, pTAL, or COBOL Instructions for ensuring that a run of the application has generated the expected raw data files Instructions for using the profmrg utility to create DPI files from raw data files Instru
Introduction to the HP Code Coverage Tool Topics This Manual Covers HP Code Coverage Tool Reference Manual for HP Integrity NonStop NS-Series Servers—542684-004 1-6
2 Installing the Code Coverage Tool The Code Coverage Tool consists of two products T0746: Code Cover Utility (codecov) T0747: Profile Merge Utility (profmrg) and support for code-coverage instrumentation in H06.
Installing the Code Coverage Tool Installing profmrg 2. Copy T0747SET to your workstation. 3. Change the name of T0747SET to setup.exe. 4. Run setup.exe. A file named Hewlett-Packard\CodeCoverage\profmrg.exe is created within the program files folder. profmrg.exe is the executable codecov program. Note. You might wish to put the location of profmrg.exe in your PATH variable.
3 Building the Application Task Overview The first step in measuring code coverage is to generate instrumented object files for all parts of the application that you want to measure. To do this, you must compile and link the source files, specifying compiler and possibly linker options to support code coverage analysis. In addition to instrumented object files, the compiler creates SPI files (which you will later combine) for subsequent input to the codecov utility. Figure 3-1.
Building the Application Understanding Code Coverage Concepts Understanding Code Coverage Concepts Code coverage reports are based on a model in which the application consists of source files, which contain functions, which contain basic blocks. A basic block is a sequence of code that is entered only at the beginning and exited at the end. Once code enters a basic block, it executes the entire block unless an exception is raised within the block.
Build the Application Building the Application Compile the application in a different directory, folder, or subvolume. Build the Application Compiling the Source Files Table 3-1 shows, for each supported platform and compiler, the options you specify to achieve code coverage. Table 3-1.
Building the Application HP Enterprise Toolkit (ETK) Considerations HP Enterprise Toolkit (ETK) Considerations For each source file that is to generate instrumented object code at compile time, you must add the appropriate compiler driver flags to the Additional box on the compiler's General page. You can add the information at the project level, in which case it applies to all source files in the project, or at the file level to select a subset of files to be instrumented.
4 Running the Application Task Overview In this step, you run the application with test data or a representative workload. A program or DLL containing instrumented code generates a distinct raw data file each time it completes execution. This raw data file is the record of what functions and basic blocks were executed during the test run. If an application is built by linking many source files and DLLs, the run generates one raw data file that contains code coverage data from all instrumented components.
Running the Application Run the Application runs. Use the same subvolume or working directory for different runs of the same source code if you want to measure the code coverage provided by all runs combined. An existing raw data file is never overwritten. If a raw data file already exists in the subvolume or directory, the instrumented program will create an additional file with a different name. Run the Application Run the application.
5 Converting Raw Data Files to DPI Files Task Overview In this step, you combine the raw data files from application runs to produce a dynamic profiling information (DPI) file for input to the codecov utility. If you have previously measured code coverage for the same application, you can combine the DPI files from the previous runs with raw data files from the latest run to produce a new DPI file. To perform this task, you use the profmrg utility, which runs on a Windows workstation. Figure 5-1.
Converting Raw Data Files to DPI Files Assembling Raw Data Files The meaningfulness of the code coverage report depends on the consistency of the SPI file, the DPI file, and the source files provided as input. Specifically, for the results of a study to be meaningful, all inputs should reflect the same versions of the source files. The profmrg utility performs no validation in this regard.
Converting Raw Data Files to DPI Files Where to Put the Input Files Where to Put the Input Files The profmrg utility looks for all the input files and creates the output file relative to some folder. By default, profmrg uses the current folder, but you can change the location with the -prof_dir option of the profmrg command, as described in Run profmrg. The profmrg utility automatically uses, as input, any file whose name has the form ZZPF* or *.dyn.
Converting Raw Data Files to DPI Files Verify Output Do not specify any other options on the command line. When you specify the help option, any other options on the command line are either ignored or produce command syntax error messages. -nologo suppresses the banner that profmrg would otherwise display. -prof_dir directory specifies the name of a folder relative to which profmrg looks for its input files and creates its output file. By default, profmrg uses the current folder.
Converting Raw Data Files to DPI Files profmrg Use of Standard Error and Output Files profmrg Use of Standard Error and Output Files The profmrg utility writes all its output to the standard error file (stderr), except that output from the -dump option is written to standard output (stdout). If profmrg does not recognize an option on the command line, it displays a message to that effect and a brief syntax message.
Converting Raw Data Files to DPI Files Example HP Code Coverage Tool Reference Manual for HP Integrity NonStop NS-Series Servers—542684-004 5-6
6 Running the Code Cover Utility Task Overview In this step, you run the Code Cover Utility (codecov), making available as input: The source files you compiled, as described in Section 3, Building the Application The SPI file you created, as described in Section 3, Building the Application The DPI file you created, as described in Section 5, Converting Raw Data Files to DPI Files The Code Coverage Tool generates the code coverage report in a set of HTML files you can view with any standard browse
Running the Code Cover Utility Prepare to Run codecov Prepare to Run codecov The meaningfulness of the code coverage report depends on the consistency of the SPI file, the DPI file, and the source files provided as input. Specifically, for the results of a study to be meaningful, all inputs should reflect the same versions of the source files. The codecov utility performs no validation in this regard.
Running the Code Cover Utility Preparing the SPI File Preparing the SPI File The codecov utility requires a single SPI file. The default name for the SPI file is: pgopti.spi if the program was compiled on Windows pgopti.
Running the Code Cover Utility Cleaning Up from Previous Runs Cleaning Up from Previous Runs The HTML files containing the code coverage report are created in the folder where you run codecov. (For information about how the files are organized, see The Code Coverage Report.) New files overwrite existing files of the same names. If you have previously run codecov in the current folder, archive the old code coverage report before you continue.
Running the Code Cover Utility Run codecov -host string provides a host address to use for access to a NonStop server. The codecov utility uses the name when fetching source files from the NonStop server. The string could be a DNS name--for example, orgdiv.arn.acorp.com--or an IP address in dotted decimal format. You must specify this option if the application includes source files on NonStop servers. -login string provides a login name for access to a NonStop server.
Running the Code Cover Utility Run codecov -passwd string specifies the password for the user name given in the -login option. If codecov must fetch source files from the NonStop server and the -passwd option is not present on the command line, codecov prompts for the password. -pcolor color specifies the name or hexadecimal code of the HTML color used in reports to show partially covered code. If the -nopartial option is present on the command line, the -pcolor option is meaningless.
Running the Code Cover Utility Verify Output Where mode is: legacy - Directs codecov to connect using the legacy (unencrypted) mode. secure_quiet - Directs the codecov to connect using the secure (encrypted) mode. If a secure connection cannot be established, the codecov uses the legacy mode. This option does not generate any diagnostics. secure_warn - Directs the codecov to connect using the secure (encrypted) mode. If a secure connection cannot be established, the codecov uses the legacy mode.
Running the Code Cover Utility The Code Coverage Report The Code Coverage Report The code coverage report consists of a hierarchy of HTML files. The top-level file is named CODE_COVERAGE.HTML and is created in the same folder where codecov runs. All the other HTML files are in a subfolder named CodeCoverage. These files also have uppercase names with the extension .HTML. Any existing files of the same names are overwritten.
Running the Code Cover Utility Example Example See Measure Code Coverage on page 8-5.
Running the Code Cover Utility Example HP Code Coverage Tool Reference Manual for HP Integrity NonStop NS-Series Servers—542684-004 6-10
7 Interpreting the Code Coverage Report Opening the Code Coverage Report To examine the code coverage report, use a browser to open the file named CODE_COVERAGE.HTML. It displays a top-level summary of the code coverage for all relevant source files, as in the following example: Figure 7-1. Coverage Summary The coverage summary indicates how many files, functions, and basic blocks were covered or uncovered. The number of files is the number that the report covers.
Interpreting the Code Coverage Report Execution Counts in the Source Display Figure 7-2. Coverage Display for a Source File The left half lists the functions that were completely uncovered and the functions that were at least partially covered. For each function that was at least partially covered, the display tells how many basic blocks were or were not covered. In these lists, the names of C++ functions are mangled.
Interpreting the Code Coverage Report Representation of #include Files appears under the code directly beneath the source position where the block begins. The count is immediately preceded by a circumflex (^). If more than one basic block is generated for the code at a source position, the number of generated basic blocks and the number of executed basic blocks follow the execution count.
Interpreting the Code Coverage Report Understanding Color Coding in the Code Coverage Report Understanding Color Coding in the Code Coverage Report Table 7-1 summarizes the colors used in the code coverage report. Table 7-1. Color Coding Default Color Meaning yellow Indicates uncovered basic blocks in a function for which some basic blocks were covered and others were not. white (no color) Indicates basic blocks that were covered. pink Indicates functions that were uncovered.
Interpreting the Code Coverage Report Understanding Color Coding in the Code Coverage Report As an example of how color coding can be misleading, consider the following code sequence. The example shows the color coding that would appear in the report. void a() { return; c(); } In this example, procedure a is called and has an unconditional return in the second line. Thus, the two lines following the return are uncovered, and you would expect them to be colored yellow.
Interpreting the Code Coverage Report Understanding Color Coding in the Code Coverage Report The count, specifically, the caret (^), appears directly under the point where codecov “thinks” the block begins. For example: int gethostsex (void) { ^ 2 This procedure was executed, so it should have been uncolored. However, the int at the beginning of the line is shown as partially covered (light brown).
Interpreting the Code Coverage Report Understanding Color Coding in the Code Coverage Report For another example, consider the following partial codecov output: if (n==1)||(n++2) ^10(1/2) In this example, the notation (1/2) indicates that two blocks were generated for the if statement, and only one of them was covered; the covered block was executed 10 times, and the other block was not executed.
Interpreting the Code Coverage Report Understanding Color Coding in the Code Coverage Report HP Code Coverage Tool Reference Manual for HP Integrity NonStop NS-Series Servers—542684-004 7-8
8 Usage Scenario The most obvious application of code coverage technology is for a quality assurance group to determine what parts of a program were executed by some set of test runs. The goal, in this case, is for the test suite to be as comprehensive as possible, ensuring that the code has been well exercised before release to users.
Usage Scenario Figure 8-1. Strategic Use of Code Coverage Technology Run Test Cases Evaluate Code Coverage Run Customer Use Cases Compare Code Coverage Enhance Test Cases vst011.
Build the Application Usage Scenario Build the Application The application in this example is called elfdump. It is a program that dumps information about object files on a NonStop server. 1. This display shows the build directory for the elfdump application. The application requires three source files (which have names ending in C) and four header files (which have names ending in H). The application will be built and executed in the Guardian environment. $DATA05.TEST 2> files $DATA05.
Run the Application Usage Scenario Run the Application 1. These command lines run the application twice, each time with different input. (In each case, $system.system.eld is the input file, but the -h and -p options cause the runs to vary.) elfdump /out output1/ -h $system.system.eld elfdump /out output2/ -p $system.system.eld 2. This display shows the working directory, with the new raw data files (which have names starting ZZPF). Each raw data file represents one run of the application. $DATA05.
Measure Code Coverage Usage Scenario Measure Code Coverage 1. This display shows the directory containing the input files for codecov. $ ls pgopti.dpi pgopti.spi zzpfo9uj zzpfu7 2. This command runs the codecov tool, specifying the host address and login information required to retrieve the elfdump source files from the Guardian file system. The prompt for a password would occur in practice but is omitted from this example.
Usage Scenario Evaluate the Code Coverage Report 2.
Usage Scenario Evaluate the Code Coverage Report 3. Scrolling down the right side of the detailed display, you see the source code, with color coding to show what was covered and what was not. The following example shows a portion of the detailed display: Note the following: Most of the lines are uncolored, meaning that they were executed. The “2” below line 111 indicates that the procedure was called twice (once for each execution of elfdump).
Usage Scenario Evaluate the Code Coverage Report HP Code Coverage Tool Reference Manual for HP Integrity NonStop NS-Series Servers—542684-004 8-8
9 Usage Considerations This section summarizes usage considerations for the Code Coverage Tool. Most of these issues are discussed in other sections of this manual but are repeated here for your convenience. Compilation Issues To support code coverage analysis, you must recompile existing program files or DLLs with the appropriate compiler and linker options, described in Section 3, Building the Application.
Usage Considerations Application Performance HP Code Coverage Tool Reference Manual for HP Integrity NonStop NS-Series Servers—542684-004 9-2
Glossary basic block. A sequence of code that is entered only at the beginning and exited at the end. Once code enters a block, it executes the entire block unless an exception is raised within the block. Although the terms “basic block” and “block” are often used interchangeably, “block” is more generic and usually refers to any block (or sequence) of instructions. code coverage. Information about which parts of the source code of a program file were executed during runs of the program file. covered.
Glossary uncovered.
Index B Block defined Glossary-1 introduced 3-2 C Code Cover Utility installing 2-1 running 6-1 Code coverage concepts 3-2 defined Glossary-1 report 1-1 display for individual source file 7-1 execution counts in 7-2 filenames 6-7 interpreting 7-1 title displayed on 6-6 codecov command syntax 6-4 compiler option 3-3 CODECOV compiler option 3-3 CodeCoverage folder 6-7 CODE_COVERAGE.
H Index H Host address for codecov access to NonStop Server 6-5 HTML files constituting code coverage report 6-7 I Include files 7-3 Inlining of function calls disabled 9-1 Installing the Code Coverage Utility 2-1 Instrumented code, defined Glossary-1 Instrumented program files and DLLs, characteristics and restrictions 9-1 L Linking the object files 3-3 Login name for codecov access to NonStop Server 6-5 M Mail address used by codecov 6-5 Mail window destination address 6-5 link text for 6-5 Mixed lan
T Index Static profiling information (SPI) file default name of 3-2 defined Glossary-1 file type and name 3-3 introduced 1-2 structure of 6-3 Steps for using Code Coverage Tool 1-2 Subvolume run each instrumented application in a different 4-1 T Task overview 1-2 compiling the application 3-1 converting raw data files to DPI files 5-1 diagram 1-4 producing raw data files for coverage analysis 4-1 running Code Cover Utility 6-1 Title on code coverage report 6-6 -fcolor option 6-4 -h option 6-4 -help opti