
Code Profiling Utilities Manual

Introduction to the Code Profiling Utilities
HP Code Profiling Utilities Manual—542684-003
1-3
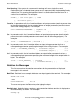
Profile-Guided Optimization
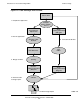
2. Run the instrumented application on the NonStop server.
When executed, the instrumented application creates a raw data file that contains
information about the execution path of the application. You can run the
instrumented application multiple times, typically using different input data,
representing different workloads, for each run. Each execution creates a unique
raw data file, located by default either in the current directory for an OSS
application or in the current subvolume for a Guardian application (the compilers
provide the option to specify a directory or subvolume).
3. Run profmrg to merge all the raw data files into one dynamic profiling
information (DPI) file. ]
You can run profmrg on either the workstation or the NonStop server. If you run it
on the workstation, you will need to copy the raw data files from the server to the
workstation.
The profmrg utility consolidates all runs and therefore all raw data pertaining to
code profiling for the application. It creates the DPI file, required as input to the
compiler.
4. Recompile the application components, providing both the original source files and
the DPI file as input.
The compiler uses the code profiling information to generate optimized object
code.
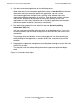
Figure 1-1 illustrates these steps.