
Code Profiling Utilities Manual


Introduction to the Code Profiling Utilities
HP Code Profiling Utilities Manual—542684-003
1-5
Code Coverage
Code Coverage
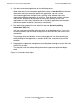
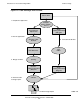
To measure code coverage for an application:
1. Compile and link application components on the NonStop server or a workstation.
For parts of the application that you wish to instrument for code coverage, use
compiler options described in Section 3, Building the Application.
The compiler generates an instrumented binary file and a static profiling
information (SPI) file.
2. Run the instrumented application on the NonStop server.
The instrumented application creates a raw data file. Each time you run the
instrumented application, a unique raw data file is created, located by default either
in the current directory for an OSS application or in the current subvolume for a
Guardian application (the compilers provide an option to specify a directory or
subvolume).
3. Run profmrg on either the NonStop server or a Windows workstation to merge all
the raw data files into one dynamic profiling information (DPI) file.
If you run profmrg on the workstation, you will first need to move the raw data files
to the workstation. If you run profmrg on the NonStop server, you will need to move
the DPI file to the workstation before running codecov.
The profmrg utility consolidates all runs and therefore all raw data pertaining to
code coverage for the application. It creates the DPI file, required as input to
codecov.
4. Run codecov on a Windows workstation to produce the code-coverage report.
The codecov utility uses the SPI file, the DPI file, and the original source files to
create a report that you can view with any HTML browser.
5. Evaluate the report, and take any appropriate action.
Figure 1-2
illustrates these steps.