
Code Profiling Utilities Manual


HP Code Profiling Utilities Manual—542684-003
3-1
3 Building the Application
Task Overview
The first step in performing profile-guided optimization or measuring code coverage is
to generate instrumented object files for all parts of the application for which you want
code profiling information. To do this, you must compile and link the source files,
specifying compiler and possibly linker options to support code profiling. For code
coverage analysis, in addition to instrumented object files, the compiler creates a SPI
file for subsequent input to the codecov utility. (You can also create multiple SPI files,
which you will later combine, but creating a single SPI file is the simpler approach.)
Prepare to Compile
Selecting Source Files
Locate all the files you want to instrument. Some reasons you might want to profile
only a subset of the application are that:
•
You have already profiled some components and now want to profile others. For
example, you might want to profile components recently added to the application.
•
The application is large and you want to economize on data space and other
resources.
•
Only certain source files belong to you.
You can instrument source files written in different languages and compiled on different
platforms as part of the same application.
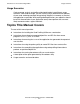
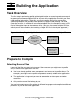
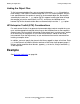
Figure 3-1. Compiling the Application to Generate Instrumented Object Files
Source Files
pTAL, C/C++,
COBOL (Code
Coverage Only)
Compiler
vst003.vsd
Static Profiling
Information (SPI)
Files (Code
Coverage Only)
Instrumented Object
Files (PGO and
Code Coverage)