
Code Profiling Utilities Manual


HP Code Profiling Utilities Manual—542684-003
8-1
8
Interpreting the Code Coverage
Report
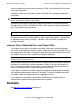
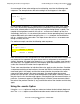
Opening the Code Coverage Report
To examine the code coverage report, use a browser to open the file named
CODE_COVERAGE.HTML. It displays a top-level summary of the code coverage for
all relevant source files, as in the following example:
The coverage summary indicates how many files, functions, and basic blocks were
covered or uncovered. The number of files is the number that the report covers. It
includes files that were listed in the SPI file and that codecov was able to find when it
ran. When the report says that a file or function is covered, it means that at least some
part of the file or function was covered, not necessarily that it was completely covered.
Below the coverage summary are lists of covered and uncovered files, with counts of
covered or uncovered functions and basic blocks for each file.
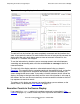
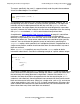
When you click a filename in the list of covered or uncovered files, the browser
displays information about that particular file.
Code Coverage Display for a Source File
The code coverage display for a source file is divided into left and right halves, as in
the following example:
Figure 8-1. Coverage Summary