
Code Profiling Utilities Manual


Interpreting the Code Coverage Report
HP Code Profiling Utilities Manual—542684-003
8-2
Execution Counts in the Source Display
The left half lists the functions that were completely uncovered and the functions that
were at least partially covered. For each function that was at least partially covered, the
display tells how many basic blocks were or were not covered. In these lists, the
names of C++ functions are mangled.
To sort the information by function name or coverage amount and switch between
ascending and descending order, click the word function or coverage in the list of
covered functions.
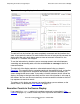
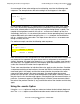
The right half of the display contains a color-coded source listing, as shown in
Figure 8-2. This source listing is created by copying in the source file itself, so function
names are not mangled here. Sequential line numbers (not edit line numbers) are
shown alongside the source code. If you select a function name on the left side of the
display, the listing on the right side scrolls until the start of that function is at the top of
the window. You can use the usual scroll keys to move around this window or the ctrl-F
key sequence to search for words.
The colors on this display are the ones you specified when you ran codecov, or the
default values, as described in Run codecov on page 7-4.
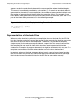
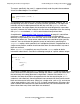
Execution Counts in the Source Display
If you specify the -counts option in the codecov command (as described in Run
codecov on page 7-4), a count of how many times a particular basic block was entered
Figure 8-2. Coverage Display for a Source File