
Code Profiling Utilities Manual

Code Profiling Usage Scenarios
HP Code Profiling Utilities Manual—542684-003
9-2
Profile-Guided Optimization Example
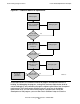
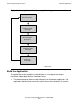
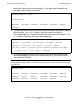
As the figure shows, the traditional method of program development consists of
building and debugging the program, starting with the lowest optimization level for
easiest debugging, and proceeding through the highest optimization level for optimal
performance. Once the program compiles and runs error-free at the highest
optimization level, you can measure the program’s performance. During the
development of the program, you can take certain additional steps to cause the
Figure 9-1. Traditional Method of Optimization
Measure the
program's
performance
Compile at optimization
level 0 and test
Recompile at
optimization level 2
and retest
Debug program
Write program
Does program
contain errors?
Recompile at
optimization level 1
and retest
Does program
contain errors?
Debug program
Does program
contain errors?
Debug program
Yes
No
Yes
Yes
No
No
vst032.vsd