
Code Profiling Utilities Manual

Code Profiling Usage Scenarios
HP Code Profiling Utilities Manual—542684-003
9-4
Run the Application to Obtain a Baseline
(Unoptimized) Measurement
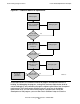
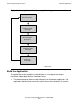
These steps are summarized here:
1. After compiling and running successfully at optimization level 2, recompile the
program using the profgen option to create an instrumented object file.
2. Run the instrumented object file one or more times to generate one or more raw
data files. You should run the program on workloads that are representative of the
cases you want to optimize.
3. Run profmrg to combine the raw data files into a single DPI file.
4. Recompile the program using the profuse option with the DPI file to create an
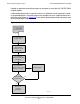
optimized program. Do any necessary debugging. Note the following:
•
Do not change the source code between the profgen compilation and the
profuse compilation.
•
Use the same version of the compiler for both compilations.
•
Use the same compiler options for both compilations (except for those
specifically related to profile-guided optimization: profgen, profuse, and profdir).
These steps are now illustrated using an example in the Guardian environment.
Run the Application to Obtain a Baseline (Unoptimized)
Measurement
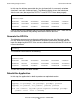
The application, called elfdump, dumps information about object files on a NonStop
server. It is assumed to be unoptimized. The following command lines run the
application, giving inputs that require a significant amount of work, as these are the
types of cases you would typically want to optimize. You would measure the
application’s performance during these runs.
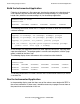
Note. As a preliminary step, you might want to run your application and measure its
performance to provide a baseline for comparison with its performance after profile-guided
optimization.
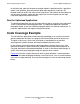
Note. If only a minor source code change is needed after the profgen compilation,
you can consider saving time by making the change and recompiling with profuse
using the existing DPI file. This eliminates the steps needed to recompile and create a
new DPI file, and your program will likely realize most of the benefits of profile-guided
optimization.
elfdump /out output1/ -Df -h -t -Xtext $system.system.eld
elfdump /out output2/ -t -u -Xtext $system.sys01.mcpdll